Top Five Luckiest And Unluckiest MLB Teams Since 2000
Contents
Sabermetrician legend Bill James discovered that a team’s current winning percentage is not the best predictor of their future winning percentage. He believed instead that the number of runs they score and give up would be a better indicator of future success. He was right, by the way. Here’s his original formula for Pythagorean Expectation:
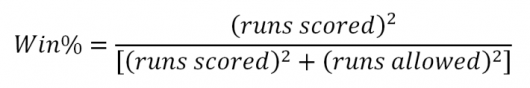
The exponent of two has since updated to 1.83, which is slightly more accurate.
Let’s look at the season series between Houston and Minnesota in 2019 as an example to illustrate his reasoning. In 2019, the Twins and the Astros played each other seven times, and the Twins won four games compared to the Astros’ three. However, the Twins only scored a total of 29 runs compared to the Astros’ 37 runs. On April 29th, the Twins beat the Astros 1-0. The following day, the Astros beat the Twins 11-0. If you were only looking at these two games, which team would you say is better?
Bill James would argue that the Astros scoring one run in the first game and then 11 in the second has more to do with randomness than it does with skill. They could have just as easily scored two runs in the first game and nine in the second and won both of the games. For this reason, a team’s general ability to score runs on offense and prevent runs on defense is more indicative of how good they truly are.
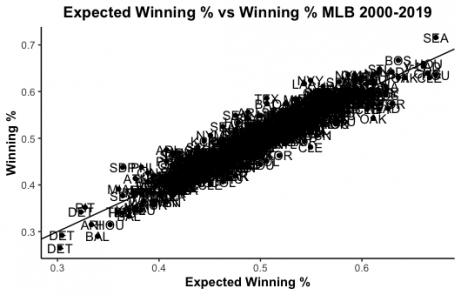
For reference, here is a scatter plot of the last 20 years of True Winning % against Pythagorean Expected Winning % (Pearson Correlation Coefficient of 0.938). The formula isn’t perfect, but it’s pretty accurate.
One of the ways the formula is used today is by comparing a team’s actual win and loss record to what their Pythagorean Expectation says their win and loss record should be. To have a better winning percentage than your Pythagorean Expectation would cause some to consider your team “lucky.” For those that finished with a worse record than their expectation suggests would be considered by some to be “unlucky.” This is how I’ll be creating a list of lucky and unlucky teams. The lists will be the five teams that most outperformed and underperformed their expectation in terms of win totals in a regular season since 2000.
Before we dive into the lists, let’s first take a look at how one-run games play a role in these lucky and unlucky seasons. Here are the ten total teams on two different graphs. The first shows a team’s winning percentage in one-run games. The second shows the difference between a team’s winning percentage and their winning percentage in one-run games only. As you’ll see from the lists below, the red bars indicate the teams that outperformed their Pythagorean Expectation, or were considered “lucky.” The blue bars indicate the teams that underperformed their Pythagorean Expectation, or were considered “unlucky.”
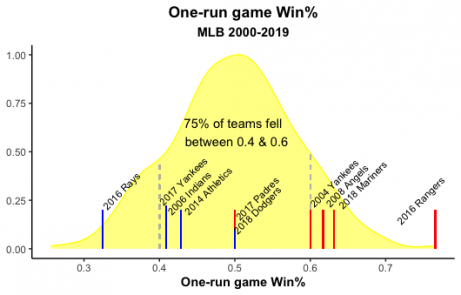
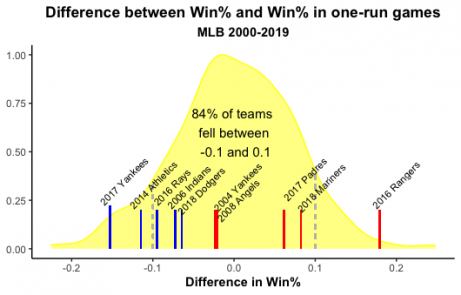
As you can see, the lucky teams tend to fare really well in one-run games and the opposite happens for the unlucky teams. In general, the closer the final score is, the more that luck is involved. That means when a team wins a proportionally higher amount of really close games than they ought to, their final win and loss record will look slightly better than it ought to.
Without further ado, here’s the two lists of the luckiest and unluckiest teams since 2000. In addition to some of the basics statistics in the first table, you’ll see both a table of how their manager has fared against his Pythagorean Expectation for his career as well as any unique statistics that stood out for that team (in many cases it is bullpen related because they have such a big impact in one-run games).
Top 5 most over-performing teams of the last 20 years:
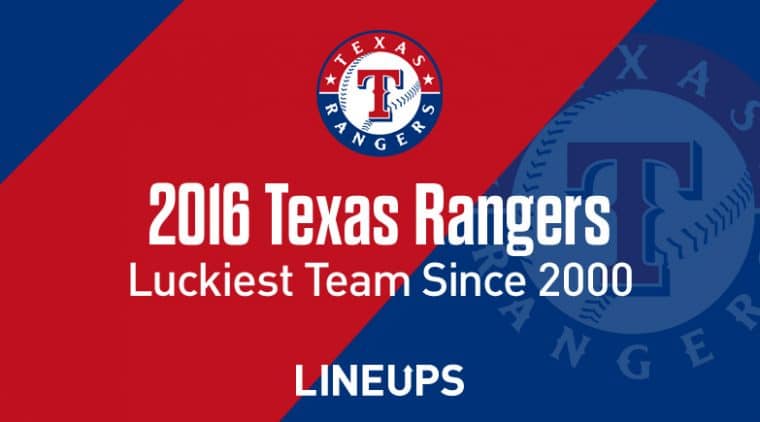
1. 2016 Texas Rangers (+13 wins)
| Actual | Expected | One-Run Games | Walk-Off Games | Runs Scored | Runs Allowed | Result |
|---|---|---|---|---|---|---|
| 95-67 | 82-80 | 36-11 (0.766) | 8-9 | 7th most | 10th most | Lost ALDS to Toronto |
Manager:
| Manager | Seasons | Record | Pythagorean Record | Average Win Differential | Average without list year |
|---|---|---|---|---|---|
| Jeff Banister | 4 | 325-313 | 311-327 | 3.5 | 0.25 |
Unique:
Highest winning percentage in one-run games of any team since 2000, sixth-highest
difference between winning percentage and winning percentage in one-run games since 2000,
tied for second-most wins in one-run games since 2000. Bullpen led the league in saves (56) and was
second in holds (103).
2. 2004 New York Yankees (+12 wins)
| Actual | Expected | One-Run Games | Walk-Off Games | Runs Scored | Runs Allowed | Result |
|---|---|---|---|---|---|---|
| 101-61 | 89-73 | 24-16 (0.600) | 7-5 | 2nd most | 12th most | Lost ALCS to Boston |
Manager:
| Manager | Seasons | Record | Pythagorean Record | Average Win Differential | Average without list year |
|---|---|---|---|---|---|
| Joe Torre | 29 | 2326-1997 | 2313-2010 | 0.448 | 0.0357 |
Unique:
Led the league in saves (59) and were tied for eleventh in holds (70). Mariano Rivera’s 53 saves are tied for sixth most all-time in a single season.
3. 2008 Los Angeles Angels (+12 wins)
| Actual | Expected | One-Run Games | Walk-Off Games | Runs Scored | Runs Allowed | Result |
|---|---|---|---|---|---|---|
| 100-62 | 88-74 | 31-21 (0.596) | 9-7 | 15th most | 9th fewest | Lost ALDS to Boston |
Manager:
| Manager | Seasons | Record | Pythagorean Record | Average Win Differential | Average without list year |
|---|---|---|---|---|---|
| Mike Scioscia | 19 | 1650-1428 | 1614-1464 | 1.89 | 1.333 |
Unique:
Francisco Rodriguez broke single-season saves record (62). Four of the five relievers to pitch at least 60 innings had an ERA below three. Bullpen allowed the third fewest runs in the league. Five starting pitchers accounted for 149 starts and were credited with 70 wins.
4. 2017 San Diego Padres (+12 wins)
| Actual | Expected | One-Run Games | Walk-Off Games | Runs Scored | Runs Allowed | Result |
|---|---|---|---|---|---|---|
| 71-91 | 59-103 | 19-19 (0.500) | 3-9 | Last | 9th most | No postseason, 4th in NL West |
Manager:
| Manager | Seasons | Record | Pythagorean Record | Average Win Differential | Average without list year |
|---|---|---|---|---|---|
| Andy Green | 4 | 274-366 | 264-376 | 2.5 | -0.667 |
Unique:
Tied for the sixth most saves in the league (45). Had one month above .500 at 14-11 (July) and finished season series 12-7 against the even worse 64-98 Giants.
5. 2018 Seattle Mariners (+12 wins)
| Actual | Expected | One-Run Games | Walk-Off Games | Runs Scored | Runs Allowed | Result |
|---|---|---|---|---|---|---|
| 89-73 | 77-85 | 36-21 (0.631) | 8-4 | 9th fewest | 14th fewest | No postseason, 3rd in AL West |
Manager:
| Manager | Seasons | Record | Pythagorean Record | Average Win Differential | Average without list year |
|---|---|---|---|---|---|
| Scott Servais | 4 | 321-327 | 312-336 | 2.25 | -1 |
Unique:
Edwin Diaz tied Bobby Thigpen for second most saves in a season (57). Starters gave up the ninth most runs and the bullpen gave up the sixth fewest. Led the league in saves (60) and were third in holds (109).
Top 5 most under-performing teams of the last 20 years:
1. 2014 Oakland Athletics (-11 wins)
| Actual | Expected | One-Run Games | Walk-Off Games | Runs Scored | Runs Allowed | Result |
|---|---|---|---|---|---|---|
| 88-74 | 99-63 | 21-28 (0.429) | 10-7 | 4th most | 3rd fewest | Lost AL Wild Card to Kansas City |
Manager:
| Manager | Seasons | Record | Pythagorean Record | Average Win Differential | Average without list year |
|---|---|---|---|---|---|
| Bob Melvin | 16 | 1224-1172 | 1227-1169 | -0.1875 | 0.533 |
Unique:
Tied for second fewest saves in the league (31) and were tied for the seventh most blown slaves. Additionally, they finished with the second fewest holds. Finished with a sub-.500 record in one-run games despite finishing the season over .500.
2. 2006 Cleveland Indians (-11 wins)
| Actual | Expected | One-Run Games | Walk-Off Games | Runs Scored | Runs Allowed | Result |
|---|---|---|---|---|---|---|
| 78-84 | 18-26 | 18-26 (0.409) | 7-12 | 2nd most | 13th fewest | No postseason, 4th in AL Central |
Manager:
| Manager | Seasons | Record | Pythagorean Record | Average Win Differential | Average without list year |
|---|---|---|---|---|---|
| Eric Wedge | 10 | 774-846 | 804-816 | -3 | -2.11 |
Unique:
Fewest saves in the league (24) and tied for the seventh most blown saves (23). Additionally, they had the fewest holds in the league (40). Bob Wickman led the team with only 15 saves.
3. 2018 Los Angeles Dodgers (-10 wins)
| Actual | Expected | One-Run Games | Walk-Off Games | Runs Scored | Runs Allowed | Result |
|---|---|---|---|---|---|---|
| 92-71 | 102-61 | 22-22 (0.500) | 6-9 | 5th most | 2nd fewest | Lost World Series to Boston |
Manager:
| Manager | Seasons | Record | Pythagorean Record | Average Win Differential | Average without list year |
|---|---|---|---|---|---|
| Dave Roberts | 4 | 393-257 | 402-248 | -2.25 | 0.333 |
Unique:
Tied for fifth most blown saves (26) despite finishing with the sixth most saves in the league (48). Finished 0.500 in one-run games despite a regular season winning percentage of 0.571.
4. 2017 New York Yankees (-9 wins)
| Actual | Expected | One-Run Games | Walk-Off Games | Runs Scored | Runs Allowed | Result |
|---|---|---|---|---|---|---|
| 91-71 | 100-62 | 18-26 (0.409) | 5-6 | 2nd most | 4th fewest | Lost ALCS to Houston |
Manager:
| Manager | Seasons | Record | Pythagorean Record | Average Win Differential | Average without list year |
|---|---|---|---|---|---|
| Joe Girardi | 11 | 988-794 | 982-800 | 0.545 | 1.5 |
Unique:
11th fewest saves (36), sixth fewest holds (70), Tied for seventh most blown saves (23)
5. 2016 Tampa Bay Rays (-9 wins)
| Actual | Expected | One-Run Games | Walk-Off Games | Runs Scored | Runs Allowed | Result |
|---|---|---|---|---|---|---|
| 68-94 | 77-85 | 13-27 (0.325) | 3-6 | 7th fewest | 15th most | No postseason, finished 5th in AL East |
Manager:
| Manager | Seasons | Record | Pythagorean Record | Average Win Differential | Average without list year |
|---|---|---|---|---|---|
| Kevin Cash | 5 | 414-396 | 419-391 | -1 | 1 |
Unique:
Finished tied for 18th in saves (42), tied for 17th in holds (75) and tied for ninth fewest blown saves (18). Seventh worst one-run winning percentage since 2000 and tied for tenth fewest one-run wins. Only team on this under-performing list to not be top five in runs scored.